Elysia 2 vs NestJS 12: Runtime +64.6%, Framework +10.6%
We moved one API from NestJS 12 on Node to Elysia 2 on Bun one layer at a time. On the database routes the runtime step bought +64.6…+81.5% throughput and the framework step +7.5…+12.7%; Elysia's own wins are memory and boot. The friction, the contention story and the hosting bill are here too.
TL;DR: We moved one API from NestJS 12 on Node 26 to Elysia 2 on Bun 1.4 in three steps, one layer each, against a ±1.2% noise floor. Everything ran on one MacBook Pro with an Apple M4 Pro (14 cores, 48 GB, macOS 27.0), load generator and Postgres on the same box. On the database routes the runtime step (Node → Bun, which also swaps the Postgres driver) bought +64.6…+81.5% throughput; the framework step +7.5…+12.7%. Elysia's own wins are memory (−43.8…−63.0% RSS under load), boot (181 → 96 ms) and 16 packages instead of 365. AOT halves boot (96 → 47 ms), cuts another 11.5…16.6% of memory under load and moves throughput by −1.5…+1.9% on every route but the hash loop. The same Nest
dist/ran on Bun unchanged.
Updated 2026-09-06: every throughput, memory and boot number below comes from a clean re-run on the same machine. The first version, published 2026-09-05, carried figures from a pass we later found was contended; what that changed is in "Where the benchmark tried to lie".
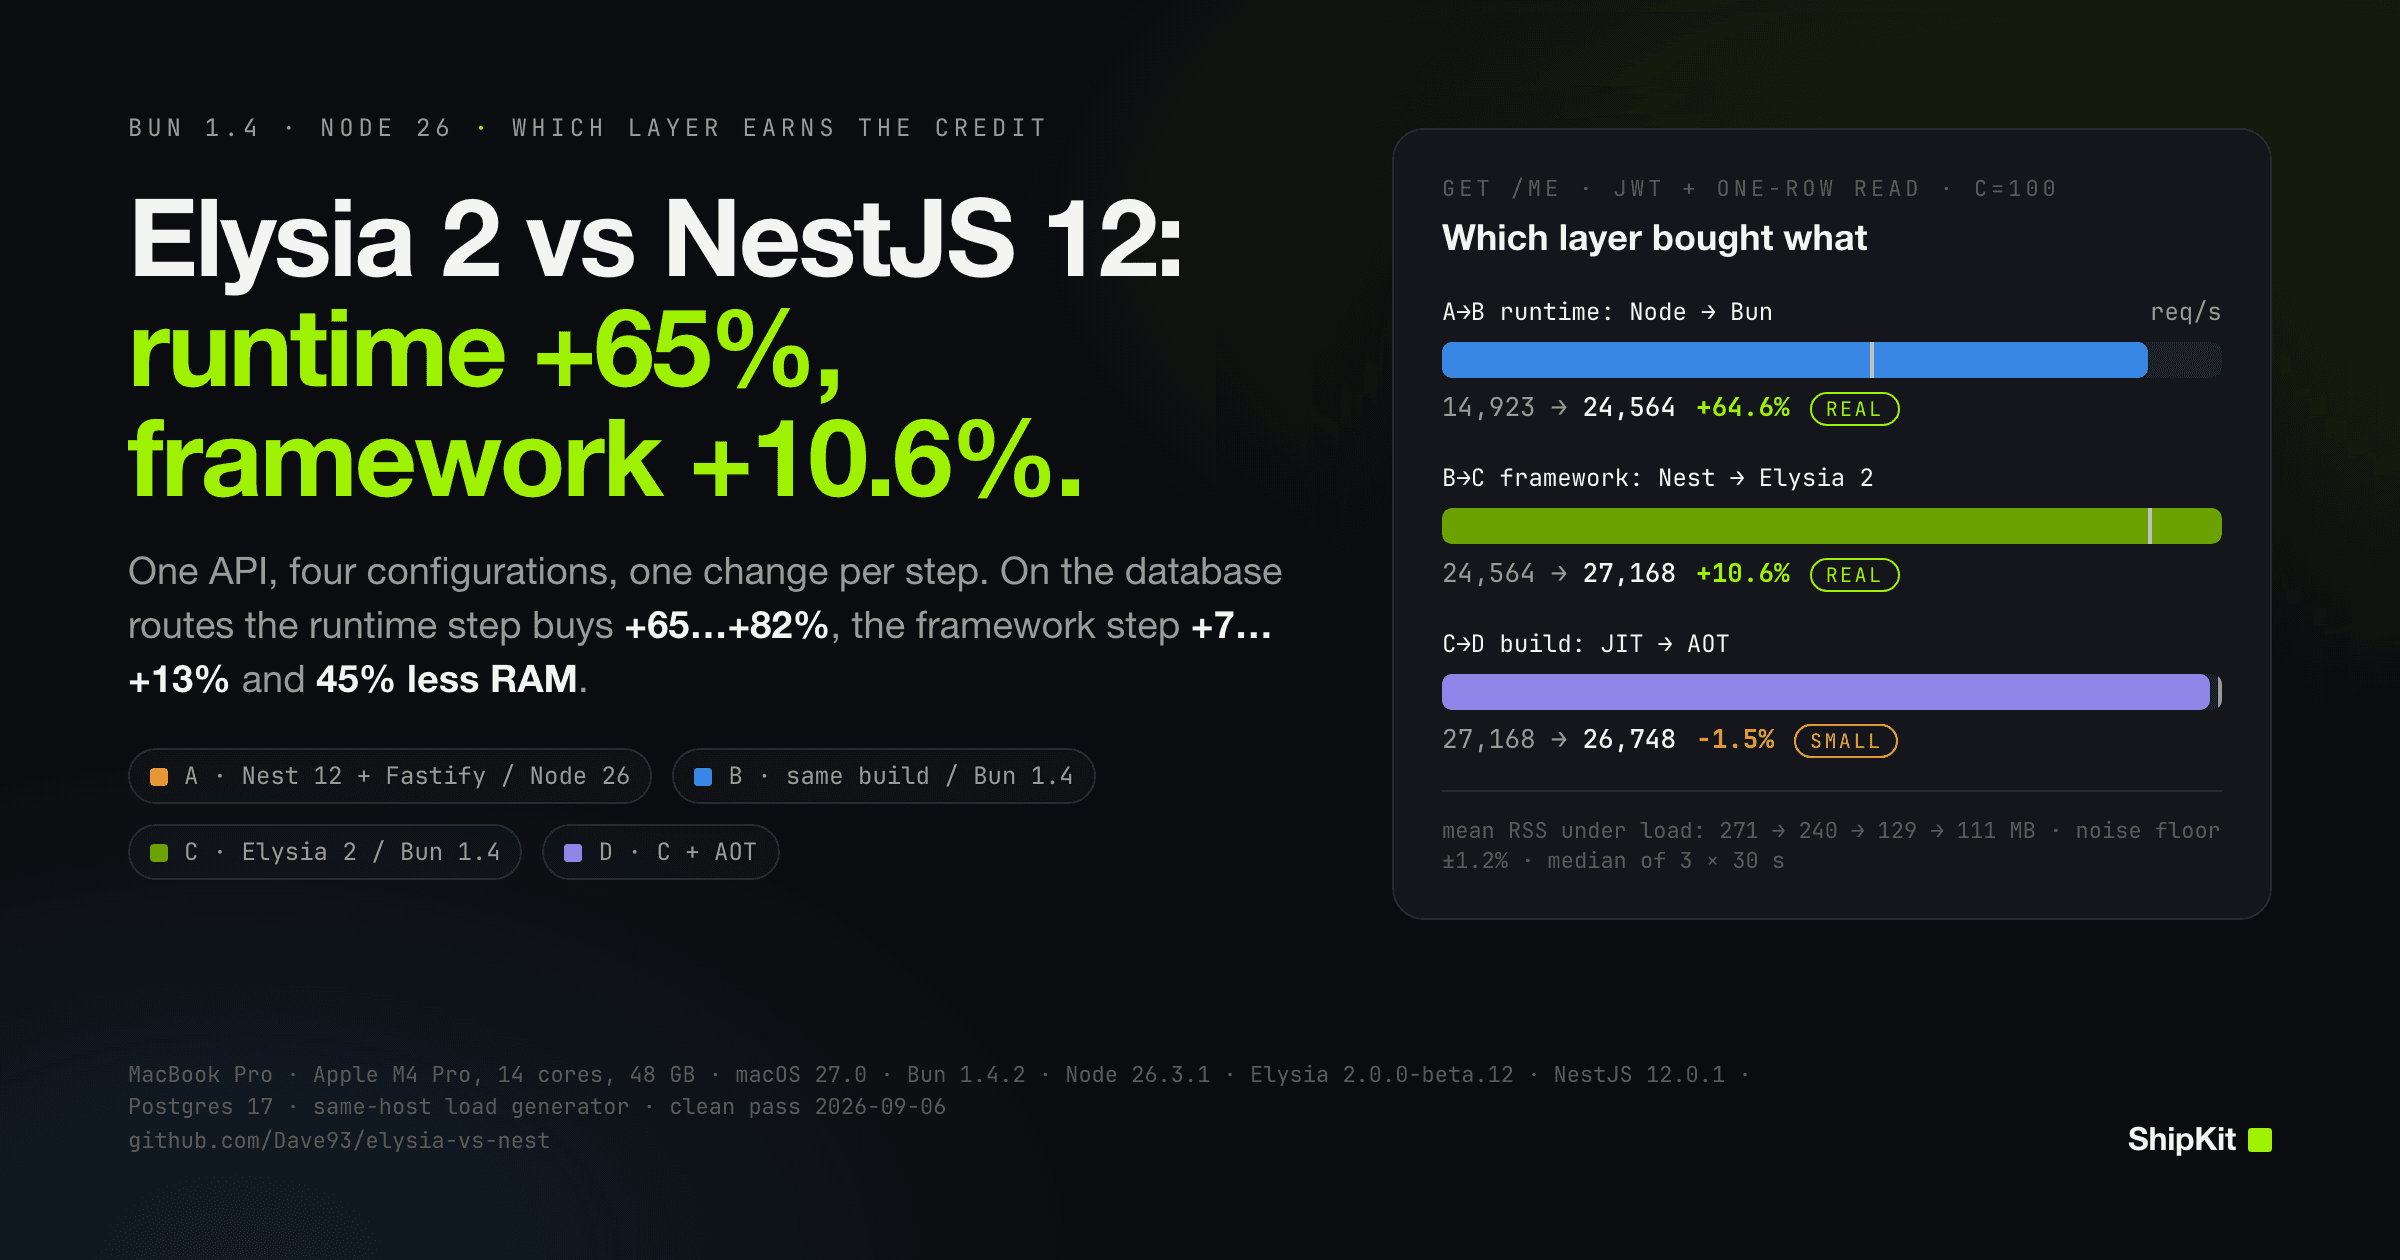
GET /me verifies a JWT and reads one row. On NestJS 12 with Fastify on Node 26 it served 14,923 requests per second at 100 concurrent connections. The same compiled Nest dist/ on Bun 1.4.2: 24,564. Elysia 2 on Bun: 27,168. Elysia 2 with the AOT plugin: 26,748.
Read that as one number and the story is "+79.2% from switching to Elysia". Read it as three steps and the story changes. The runtime step is worth +64.6%. The framework step, +10.6%. The build step lands at −1.5%, small. Most of the headline belongs to the runtime, and that layer is the one a Nest team can take without rewriting a route.
The previous article in this series asked the same question on a dev server at ±10%; this one runs production builds at ±1.2% and logs what broke.
Four configurations, three steps
The machine: one MacBook Pro with an Apple M4 Pro, 14 cores, 48 GB, macOS 27.0. The load generator (bombardier), the API under test and PostgreSQL 17.10 all ran on it, and every configuration ran as a single process, no cluster mode. The versions: Bun 1.4.2, Node v26.3.1, Elysia 2.0.0-beta.12, @nestjs/core 12.0.1.
Every throughput and under-load memory number is the median of three 30-second runs after a discarded 5-second warm-up, at concurrency 10, 100 and 500, in the order A → B → C → D, all four in one pass on 2026-09-06.
Config A is NestJS 12 with Fastify on Node 26, built by nest build with the SWC builder, on Drizzle and postgres.js. B is that same dist/ started with bun dist/main.js; the driver becomes Bun SQL, because the driver follows the runtime by design. C is Elysia 2 on Bun with the same driver and schema. D is C built with the aot() plugin. A → B changes the runtime and the Postgres client, B → C only the framework, C → D only the build step, and A → D is the whole swap.
Seven routes, identical in both apps, against a database seeded with 50,000 users and 200,000 orders: /health, POST /echo (body validation), GET /me (JWT check plus one read), GET /users/:id, a 20-row list, POST /orders (validated insert) and GET /cpu?n=15000 (15,000 chained SHA-256 hashes). A parity script compares every response body byte for byte before any run starts; logging is off and the pool size is 10.
Pick a route below (six; /cpu has its own section) and flip between the req/s and memory tabs; each chip marks its step as noise, small or real.
GET /me — JWT + one-row read · req/s
table view
| step | from (req/s) | to | Δ | verdict |
|---|---|---|---|---|
| A→B | 14,923 | 24,564 | +64.6% | real |
| B→C | 24,564 | 27,168 | +10.6% | real |
| C→D | 27,168 | 26,748 | −1.5% | small |
| A→D | 14,923 | 26,748 | +79.2% | real |
The pattern splits by whether a route touches the database. On the four DB routes the runtime step is +64.6…+81.5% req/s and the framework step +7.5…+12.7%; the whole swap, A → D, is +79.2…+99.4% req/s and −43.0…−59.1% RSS under load. On /health and /echo, which never reach Postgres, the runtime step is −0.0% (noise) and +13.0% while the framework step is +37.8% and +60.7%. Framework-only routes belong to the framework; database routes belong to the runtime.
How honest are these numbers?
Before the main run we hit /health and /users/4242 on configuration C five times back to back, 30 seconds each, at c=100. /health came back at 137,941, 139,556, 138,919, 139,289 and 139,109 rps, a spread of 1.2%; /users/:id spread 0.9%. That 1.2% is the floor: inside it is noise, up to 10% is small, 10% and above is real. Any combination with more than 1% non-2xx is marked invalid, because its rps counts connection resets rather than served requests.
The five runs and the three bands every chip in this article is judged against:
ticks: the two measured spreads
table view
| route | runs (req/s) | spread |
|---|---|---|
| GET /health | 137,941, 139,556, 138,919, 139,289, 139,109 | 1.2% |
| GET /users/:id | 34,161, 34,194, 33,905, 34,218, 34,103 | 0.9% |
Three caveats stay attached to every number. It is a laptop, so only comparisons between configurations on the same harness carry weight. The load generator shared the machine, so at c=500 the client competes with the server for cores. And the machine drifts: on 2026-09-05, A re-measured after that afternoon's pass moved −2.8% on /health, +6.5% on /users/:id and −1.7% on /orders, all small. Elysia 2.0.0-beta.12 is a beta; @nestjs/core 12.0.1 is a stable release.
What Bun buys, and how much is the driver
Config B is the Nest build with nothing changed, started with bun dist/main.js instead of node dist/main.js. At c=100 that alone moved GET /me from 14,923 to 24,564 rps (+64.6%), GET /users/:id from 18,173 to 30,871 (+69.9%), the list from 12,882 to 22,983 (+78.4%) and POST /orders from 14,419 to 26,174 (+81.5%). Idle RSS fell from 197 MB to 90 MB and boot from 400 ms to 181 ms.
Under load the runtime step's effect on memory was mixed: −11.6% on /me, −6.1% on /users/:id, +22.0% on the list, +9.2% on /orders. On /health Bun and Node tied, 103,273 against 103,238 rps, noise; on /echo, which parses and validates a body, Bun was 13.0% ahead, real. Nest and Fastify run on Bun through the node:http compatibility path; on the empty route it matched Node's own server.
Config B also swapped the driver: postgres.js on Node, Bun SQL on Bun. Put postgres.js back under the Nest build on Bun and a fifth to a third of B's throughput on the DB routes goes away: 20.8% on /me, 26.8% on /users/:id, 28.9% on the list, 32.0% on /orders; /echo, with no database in it, moved +2.1%, small. So a fifth to a third of what B serves on the database routes is the driver, not Bun itself.
For a Nest team, B is the finding: the compiled output ran on Bun without an edit and passed byte parity on all seven routes.
What Elysia 2 earns on its own
B → C holds the runtime and the driver fixed. On the DB routes the framework step is worth +10.6% on /me, +12.7% on /users/:id, +9.7% on the list and +7.5% on /orders: two real, two small, all four short of the runtime step above them. Per core the same step is +5.8%, +9.7%, +4.9% and +7.2%, which is why C and B need almost the same cores in the cost model.
Mean RSS under load fell 46.4% on /me, 43.8% on /users/:id, 44.0% on the list, 45.5% on /orders, 63.0% on /health and 60.9% on /echo. Idle RSS went from 90 MB to 39 MB and boot from 181 ms to 96 ms, median of ten cold starts.
The four cold starts side by side, with idle RSS and the first database request next to each:
table view
| config | boot → healthy | idle RSS | first DB request |
|---|---|---|---|
| A · Nest 12 + Fastify · Node 26 | 400 ms | 197 MB | 17.0 ms |
| B · Nest 12 + Fastify · Bun 1.4 | 181 ms | 90 MB | 13.1 ms |
| C · Elysia 2 · Bun 1.4 | 96 ms | 39 MB | 17.7 ms |
| D · Elysia 2 + AOT · Bun 1.4 | 47 ms | 33 MB | 15.3 ms |
Across the whole stack: a one-line edit reloads in 64 ms with bun --watch on the Elysia app and 738 ms with nest start --watch on Nest on Node; node_modules weighs 55 MB in 16 packages against 208 MB in 365.
AOT halves boot and little else
C → D at c=100: /health −0.6%, /echo +0.5%, /users/:id −0.8% and /orders −0.4%, all noise; /me −1.5% and the list +1.9%, small; /cpu +6.2%, small. The first version of this article had /me at −5.9% for the same step, so we ran C and D alternately, C, D, C, D, on /health, /me and /users/:id, three 30-second runs per cell. /health came back 142,087, 141,856, 141,796 and 142,234 rps; the four /health cells sit within 0.3% of each other, and on no route do the C and D means differ by more than 1.3%. Means: /health +0.1% (noise), /me −1.3% (small), /users/:id −0.9% (noise). Yesterday's −5.9% was the contended machine.
Memory improved on every route, from −11.5% on /health to −16.6% on the list; idle RSS went from 39 MB to 33 MB.
The number AOT owns is boot: 96 ms → 47 ms to the first healthy response. The price is a 122 ms build instead of 17 ms and a 1,332 KB bundle instead of 772 KB, 72% larger, because route handlers and validators are inlined instead of generated at start. For one long-running process AOT is a memory feature.
Where the benchmark tried to lie
Three times in two days a number looked like a finding, and a fourth is in the AOT section above. None held; the last section here is what closing them cost.
49,393 rps that never happened
GET /cpu?n=15000 at c=100 on config A reported a median of 49,393 rps. The same route at c=10 served 208 rps with a p99 of 88 ms, and a loop of 15,000 hashes does not finish 49,000 times a second on one core. The counters explained it: 1,419,202 non-2xx, 99.68% of requests. A 10-second probe on 2026-09-05 with bombardier's full error split showed 1,633 served responses and 165,298 failures, 153,710 of them connection resets: while the event loop was pinned, Node's HTTP server reset incoming connections, bombardier reconnected in a tight loop, and each reset landed in the rps column. Elysia on Bun on the same probe: 2,171 served, 0 errors, p99 506 ms.
The 2026-09-05 probe for A and C, with the struck-out 49,393 kept:
table view
| config | served (2xx) | connection resets | other errors | p99 |
|---|---|---|---|---|
| A | 1,633 | 153,710 | 11,588 | — |
| C | 2,171 | 0 | 0 | 506 ms |
The run order decided /orders
On 2026-09-05, after the day's runs, pg_stat_user_tables for orders showed 200,000 live rows, 5,911,710 dead tuples, 79 autovacuums and 547 MB on disk. Each configuration inserted about 5 million rows; the reset deleted them without vacuuming, so the next configuration wrote into a bloated table while autovacuum ran beside it, at 73–78% server CPU on a route that should pin a core. In the morning pass A ran first at 13,395 rps, CPU-bound, and B, C and D behind it managed 13,110, 15,469 and 14,626; in the afternoon B ran first and won, 22,336 against 15,473 for C and 15,427 for D.
The fix went into the harness: before every configuration the table goes back to its 200,000 seeded rows and VACUUM (FULL, ANALYZE) orders runs, so all four measured /orders under one reset. Those are the numbers of record: A 14,419, B 26,174, C 28,125, D 28,017 rps. A fresh-table cross-check after the main run gave A 15,044, B 26,622, C 20,471 and D 22,623, with C and D at 78% and 84% server CPU. Postgres state after eight million inserts in one session still drifts, VACUUM FULL or not, and it lands on whichever configuration runs late. The dead tuples, the two 2026-09-05 run orders and the vacuumed main pass:
- live rows
- 200,000
- inserts / deletes
- 32,004,978 / 31,804,978
- autovacuums
- 79
- on disk
- 547 MB
table view
| config | clean-pass req/s | p99 | dead tuples before |
|---|---|---|---|
| A | 14,419 | 9.42 ms | 0 |
| B | 26,174 | 7.21 ms | 0 |
| C | 28,125 | 8.45 ms | 0 |
| D | 28,017 | 8.17 ms | 0 |
A Bun 1.4.2 drop that only Nest saw
On 2026-09-05 B, C and D were measured on Bun 1.4.1-canary in the morning and on the 1.4.2 release in the afternoon. Elysia showed no regression; Nest-on-Bun lost 11.5% on /health and 8.3% on /echo, in both the contended pass and the one we then believed was clean. The first version of this article called that a lead: Bun.serve held, the node:http path Nest and Fastify take on Bun did not.
The clean pass closed it. A and B tie on /health, 103,273 against 103,238 rps, a −0.0% step inside the floor, and B on 1.4.2 matches its own 1.4.1-canary morning, 101,592 rps then. The drop was the machine.
The contended pass
The 2026-09-05 afternoon first. The first 1.4.2 rerun of B came in 6–19% below the canary at c=100, /cpu included. The cause was on the host: a typecheck from an unrelated project at 104% CPU, on top of a ~250% baseline from desktop apps, for a load average of 19 on 14 cores. The harness gained a sampler that reads foreign CPU once a second, waits until it is below a gate, and redoes any 30-second window that saw more. With the gate at 400% the afternoon pass reported zero contended combinations and still produced the two closed questions above.
Then the overnight attempt: 36 of 84 combinations in ten hours, 848 windows redone. Foreign CPU sat at 300–380% all night with no user work running, macOS dasd at 80–88%, notifyd at 22–28%, launchd at 23%, PerfPowerServices and analyticsd behind them, most likely provoked by the harness spawning ps twice a second for hours. The 350% gate sat inside that band, so the sampler spent the night rejecting its own load. Two B combinations were accepted contended after 200 retries. We discarded the pass.
The final pass ran from 10:06 to 13:03 with the gate at 600%, above the daemon baseline: noise floor first, then all four configurations in one run, zero contended combinations, foreign CPU medians between 140% and 400%. Every throughput, memory and boot number in this article not dated 2026-09-05 comes from it.
The bill in machines
The cost model takes each configuration's mean rps per core across the four DB routes at c=100 (13,978 / 22,631 / 24,260 / 23,967 for A through D) and its highest peak RSS among them (311 / 327 / 179 / 155 MB), runs cores at 50%, sizes RAM at 1.5× peak, and picks the cheapest plan count per provider.
At 20,000 rps sustained A needs 2.86 cores; B, C and D need 1.77, 1.65 and 1.67. On a fixed 2 vCPU / 4 GB box class that is two machines for A and one for the other three: Hetzner CAX11 at $14 against $7, Fly.io shared-cpu-2x at $44 against $22, AWS t4g.medium at $50 against $25. The second box disappears at B, before a line of Elysia code is involved. At 100,000 rps it is eight boxes against five. Machines per provider at each load:
box = CAX11 · 2 vCPU / 4 GB, running cores at 50%
table view
| load | config | Hetzner (CAX11 · 2 vCPU / 4 GB) | Fly.io (shared-cpu-2x 4GB) | AWS (t4g.medium) |
|---|---|---|---|---|
| 5,000 | A | × 1 = $7/mo | × 1 = $22/mo | × 1 = $25/mo |
| 20,000 | A | × 2 = $14/mo | × 2 = $44/mo | × 2 = $50/mo |
| 50,000 | A | × 4 = $28/mo | × 4 = $89/mo | × 4 = $99/mo |
| 100,000 | A | × 8 = $56/mo | × 8 = $178/mo | × 8 = $199/mo |
| 5,000 | B | × 1 = $7/mo | × 1 = $22/mo | × 1 = $25/mo |
| 20,000 | B | × 1 = $7/mo | × 1 = $22/mo | × 1 = $25/mo |
| 50,000 | B | × 3 = $21/mo | × 3 = $67/mo | × 3 = $74/mo |
| 100,000 | B | × 5 = $35/mo | × 5 = $111/mo | × 5 = $124/mo |
| 5,000 | C | × 1 = $7/mo | × 1 = $22/mo | × 1 = $25/mo |
| 20,000 | C | × 1 = $7/mo | × 1 = $22/mo | × 1 = $25/mo |
| 50,000 | C | × 3 = $21/mo | × 3 = $67/mo | × 3 = $74/mo |
| 100,000 | C | × 5 = $35/mo | × 5 = $111/mo | × 5 = $124/mo |
| 5,000 | D | × 1 = $7/mo | × 1 = $22/mo | × 1 = $25/mo |
| 20,000 | D | × 1 = $7/mo | × 1 = $22/mo | × 1 = $25/mo |
| 50,000 | D | × 3 = $21/mo | × 3 = $67/mo | × 3 = $74/mo |
| 100,000 | D | × 5 = $35/mo | × 5 = $111/mo | × 5 = $124/mo |
B sits in the same column as C and D at every load, so the hosting win belongs to the runtime step. Elysia's memory shows up only where a provider sells RAM in small steps: on Fly.io's cheapest-plan sizing at 20,000 rps, D fits in two 256 MB machines for $4 and C in three for $6, while B needs two 512 MB machines for $7. The figures exclude the database, bandwidth and a load balancer; they rank the four stacks and nothing more.
The friction log
Nest 12 under Bun straight from TypeScript source failed before the first route registered:
$ bun main.ts
TypeError: undefined is not an object (evaluating 'descriptor.value')
  at @nestjs/common/decorators/http/request-mapping.decorator.js:12
Bun compiles TypeScript with TC39 decorators unless tsconfig.json says otherwise:
// without both flags Bun emits TC39 decorators and every @Get/@Post throws on descriptor.value
{ "compilerOptions": { "experimentalDecorators": true, "emitDecoratorMetadata": true } }
Config B runs the SWC-built dist/ and never hit this; that build had its own trap. The Nest 12 CLI scaffolds an ESM project ("type": "module", top-level await bootstrap()), yet nest build with the SWC builder emitted CommonJS into it:
node dist/main.js
ReferenceError: Cannot determine intended module format because both
'exports' and top-level await are present  (ERR_AMBIGUOUS_MODULE_SYNTAX)

bun dist/main.js
ReferenceError: exports is not defined
The CLI's SWC defaults ignore the tsconfig module setting. The fix is an .swcrc with "module": { "type": "es6" } plus legacyDecorator and decoratorMetadata.
TypeBox 1.3.26 exposes no ~standard on Type.Object(...) or Compile(...), so Nest 12's @Body({ schema }) cannot take it directly; the sensitivity run used a 17-line Standard Schema adapter. On rejection Nest's StandardSchemaValidationPipe answers 400 with {"message":[...],"error":"Bad Request","statusCode":400} and Elysia 2 answers 422 with an RFC 9457 body; the benchmark never sends an invalid body, and a client that branches on 400 will notice on day one.
The Elysia side of the log is short: aot("src/app.ts") worked on the first try, and the AOT build script needs a process.exit(0) after it finishes.
Measuring your own stack
If the API is Nest and the box is busy, run the existing dist/ on Bun before touching a route. That is config B: +64.6…+81.5% on the database routes here, and boot from 400 ms to 181 ms. Then run the driver both ways, because on the database routes a fifth to a third of B's throughput here is the driver.
Measure the noise floor before the comparison; five back-to-back runs of one route gave us 1.2% on a quiet morning and 2.6% the day before. Sample foreign CPU once a second and gate on it, with the gate above whatever your machine's daemons idle at: ours sat inside that band once and the harness retried all night. Vacuum before every insert benchmark and keep the error split.
Choose the framework step for what it owns: −43.8…−63.0% RSS under load, a 96 ms boot and 16 packages. On the database routes it is worth +7.5…+12.7% in requests per second and +4.9…+9.7% per core, and the beta tag is the price. Budget AOT for the 47 ms cold start.
Where ShipKit fits
ShipKit runs Elysia 1.4.16 in its API today and does not ship Elysia 2: the framework is a beta at 2.0.0-beta.12, and every official plugin we checked ships its Elysia 2 build as a beta too.
Sources
- Benchmark repository with code, harness, results and methodology: https://github.com/Dave93/elysia-vs-nest
- Previous article in this series, "Bun Owns the Speed, Elysia Owns the Memory: What We Learned Upgrading Every Layer at Once" (2026-08-08): https://shipkit.davrapps.dev/en/blog/bun-elysia-2-upgrade-what-each-layer-buys
- Elysia 2 announcement: https://elysiajs.com/blog/elysia-20.html
- Bun 1.4 release post: https://bun.sh/blog/bun-v1.4