TimescaleDB vs plain Postgres: the route that fell from 25,426 requests a second to 63.3
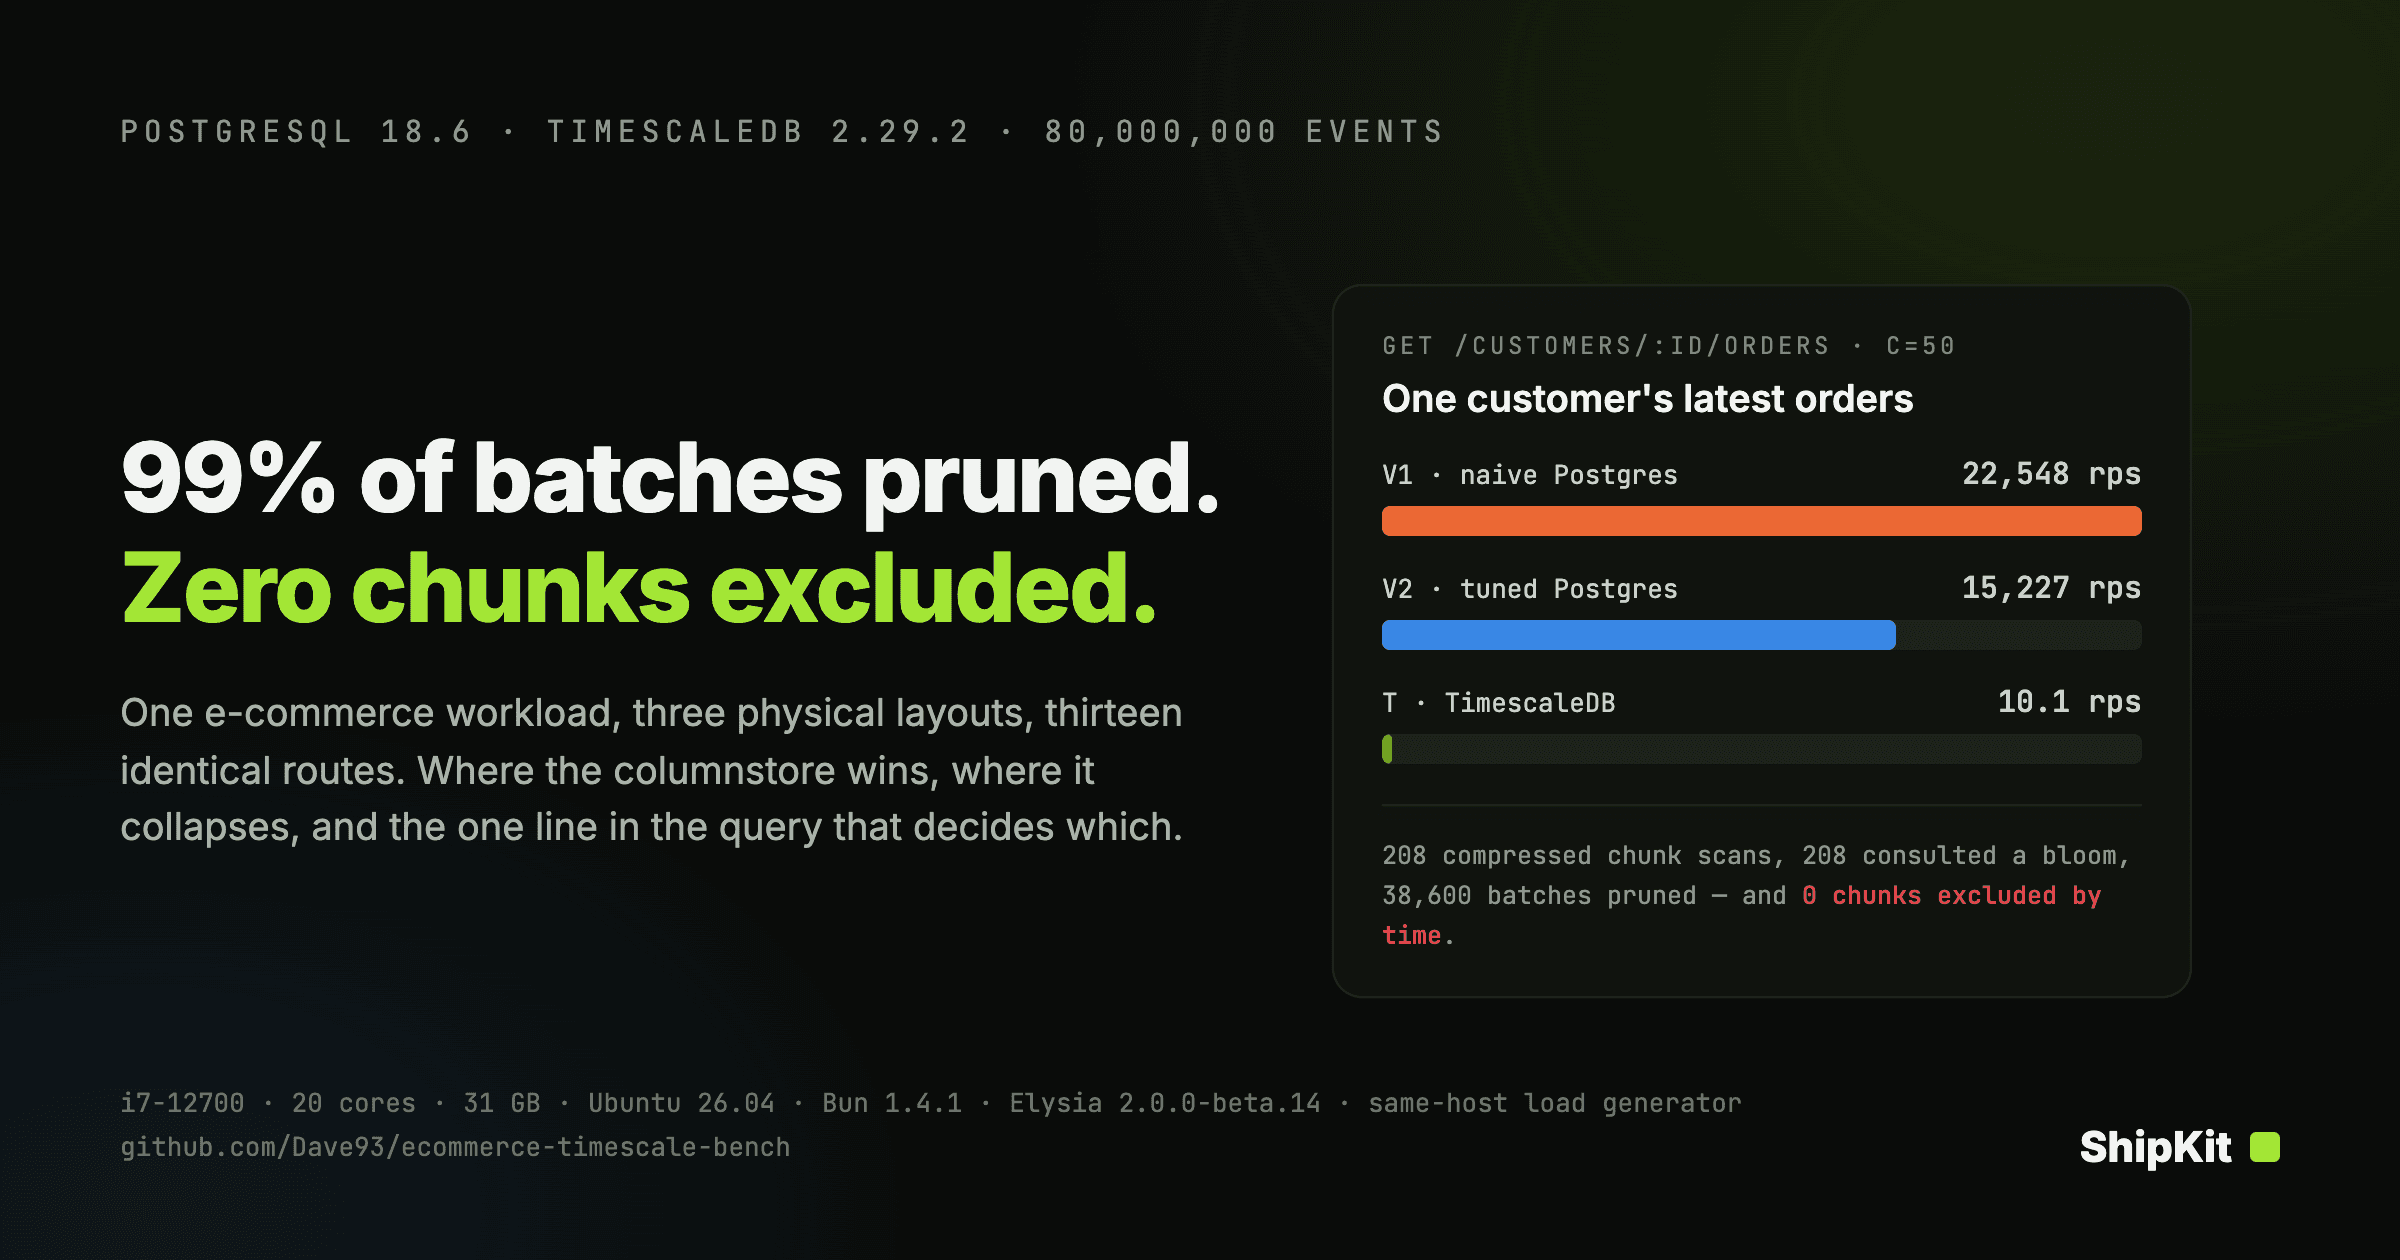
One Elysia application over three physical layouts of the same shop: naive Postgres, hand-tuned Postgres and TimescaleDB. Where the columnstore wins, where it collapses, and the one line in the query that decides which.
One Elysia application, thirteen routes, three databases underneath it holding the same rows and answered by the same handlers. Only the physical layout changed.
On the naive Postgres build, GET /products/:id served 25,426 requests a second at concurrency 50. The hand-tuned build managed 15,544. On TimescaleDB the same route served 63.3. The same code path against the same row on the same box.
No setting in a config file moves a route by that margin. A different access mechanism is doing the work, and it is predictable enough that you can tell in advance which of your own queries will do the same.
Three builds, and why the middle one carries the argument
The three databases were built from one CSV dump: 300 categories, 50,000 products, 500,000 customers, 5,000,000 orders, 15,002,812 order items and 80,000,000 events, 6.90 GB in all. Parity was gated first: sum(orders.total) and sum(order_items.line_total) both come to 7,052,627,494.12 in all three.
V1 is naive Postgres: plain tables, btree indexes, analytics computed straight off the raw rows. That is what most startups ship. V2 takes the same schema and hand-tunes it: monthly range partitions, BRIN indexes on the time columns, six materialized views. That is the price of hand tuning, and any Postgres installation can pay it. T adds the extension: TimescaleDB 2.29.2, with hypertables, six continuous aggregates, columnstore compression and configurable bloom sparse indexes.
V1 to V2 is what hand tuning buys. V2 to T is what the extension itself adds. Holding T up against V1 alone would be a straw man in either direction, so every claim below is graded against V2 unless it says otherwise. V2 is no free win either: on the storefront routes it loses to V1, the product route by 38.9%, the orders history route by 32.5%, the catalog route by 19.3%. Partitioning and materialized views bought the analytics numbers further down and charged the storefront for them.
Where the storefront went
a page of products, each with its lifetime units
250× between the fastest and the slowest layout on this route.
table view
| route | design | rps | p50 | p99 | mean statement |
|---|---|---|---|---|---|
| health | V1 | 214,803 rps | 0.22 ms | 0.43 ms | 0.12 ms |
| health | V2 | 216,423 rps | 0.22 ms | 0.43 ms | 0.18 ms |
| health | T | 213,893 rps | 0.22 ms | 0.45 ms | 0.55 ms |
| search | V1 | 178 rps | 261.78 ms | 397.98 ms | 56.05 ms |
| search | V2 | 178 rps | 261.67 ms | 396.74 ms | 55.88 ms |
| search | T | 137 rps | 344.27 ms | 494.55 ms | 72.89 ms |
| catalog | V1 | 150 rps | 332.91 ms | 336.40 ms | 66.41 ms |
| catalog | V2 | 121 rps | 414.07 ms | 417.92 ms | 82.27 ms |
| catalog | T | 0.6 rps | 44.3 s | 81.9 s | 11.2 s |
| product | V1 | 25,426 rps | 1.83 ms | 3.77 ms | 0.32 ms |
| product | V2 | 15,544 rps | 2.85 ms | 6.34 ms | 0.54 ms |
| product | T | 63.3 rps | 744.45 ms | 1.2 s | 154.35 ms |
| orders_history | V1 | 22,548 rps | 2.12 ms | 4.15 ms | 0.29 ms |
| orders_history | V2 | 15,227 rps | 2.77 ms | 6.49 ms | 0.49 ms |
| orders_history | T | 10.1 rps | 4.6 s | 7.9 s | 951.52 ms |
The catalog page goes to 0.6 requests a second against V2's 121, the single-product route to 63.3 against V2's 15,544, and a customer's order history to 10.1 against V2's 15,227. On V1 those last two read 25,426 and 22,548.
Latency says the same thing in the other unit. On T, p99 for the catalog route is 81,936.84 ms, for the product route 1,235.25 ms, for the orders history route 7,920.31 ms, against 336.40 ms, 3.77 ms and 4.15 ms on V1. Postgres' own mean statement time reports it from inside the server: 11,221.39 ms, 154.35 ms and 951.52 ms on T, against 66.41 ms, 0.32 ms and 0.29 ms. The application was not the bottleneck. At concurrency 200 the shape does not change.
The row that explains it
None of the three collapsed routes carries a time predicate.
The catalog route renders a category page, and for each of the 167 products in category 7 it runs a lateral subquery:
-- once per product on the page
SELECT sum(oi.qty)
  FROM order_items oi
 WHERE oi.product_id = p.id;
Over all of history. The orders history route filters by customer_id, orders by time and takes a LIMIT, with no lower bound on the time column. Both are ordinary application queries. Neither says anything about when.
A hypertable partitions by time, and its first and best pruning mechanism is chunk exclusion: the planner reads the time predicate, works out which chunks could contain matching rows, and never opens the rest. A query that asks about all of history forfeits that. order_items has 106 chunks here, orders another 106, and all of them get opened, once per product on the page.
What is left after chunk exclusion fails is the sparse index. EXPLAIN (ANALYZE) on the orders history query gives the counters in one row: across 208 compressed chunk scans, every one consulting a bloom filter on customer_id and order_id, 38,600 batches were pruned and 377 decompressed, 99.0% of them skipped. Chunks excluded, at startup and at runtime: zero.
Ninety-nine per cent of batches pruned, and not one chunk excluded: that is the mechanism. A sparse index skips batches inside a chunk. It cannot avoid opening the chunk. A btree seeks.
orders_history, as the executor counted itA sparse index skips batches inside a chunk. It cannot avoid opening the chunk, and none of these queries carries a time predicate, so every chunk is opened on every request. A btree seeks.
table view
| route | on 2.18.2 | on 2.29.2 | p99 | V1 btree | batches pruned | chunks excluded |
|---|---|---|---|---|---|---|
| catalog | never completed a request | 0.6 rps | 81.9 s | 150 rps | 33,418 of 33,847 | 0 |
| product | not reached | 63.3 rps | 1.2 s | 25,426 rps | 32,255 of 32,681 | 0 |
| orders_history | 100% timeouts | 10.1 rps | 7.9 s | 22,548 rps | 38,600 of 38,977 | 0 |
EXPLAIN (ANALYZE) on the same SQL, read out of results/sparse-check.json. The 2.18.2 column is the abandoned macOS pass, where these routes returned nothing at all, so there is no number to quote for it. Running the same EXPLAIN with chunk skipping switched off returns identical counters, because there was never any chunk skipping to switch off.Re-running the plan with chunk skipping switched off returns identical counters, to the last digit: 99.03319484935024% both times, because there was never any chunk skipping to switch off. The btree on (product_id, created_at DESC) does exist in T, but on a compressed chunk it indexes the compressed representation rather than the rows, so it cannot serve the lookup the way its twin does in V1.
The version history cuts both ways. An earlier abandoned pass on TimescaleDB 2.18.2, before configurable bloom sparse indexes landed in 2.22, ran the same code against the same routes: the catalog route never completed a request, the product route was never reached, and the orders history route returned 100% timeouts. That pass ran on a different machine and a different Postgres, so its column is a state and never a number. Bloom is real and it demonstrably works: routes that previously returned nothing now return answers. The gap to a btree on the same data is still three orders of magnitude, and no columnstore setting closes it. Both halves are the finding.
Which of your queries will collapse
A query that names a time range on the partitioning column prunes chunks and behaves. One that filters on a non-time column and expects an index seek opens every chunk and relies on batch pruning to save it, and batch pruning is a filter, not a seek. The cost grows with the chunk count as the table ages, and the catalog route multiplies it by the page size. Point lookups are the worst case, and the commonest shape in a storefront.
The control that did not come out flat
Three controls ran alongside everything else. GET /health, which touches no database, reads 214,803, 216,423 and 213,893 requests a second across V1, V2 and T, a spread of 1.2%. POST /events at one event per request reads 5,585, 5,565 and 5,464, a spread of 2.2%. Both sit above the 0.9% floor, and neither separates the three databases the way the storefront routes do.
The third control is the honest problem in this dataset. GET /search?q=pro is a trigram match on products, a plain table of identical size, 10.5 MB, in all three databases, served by literally the same function, since the TimescaleDB query module re-exports V1's. It reads 178, 178 and 137 requests a second, at both concurrency levels. T pays roughly 23% on a route with no hypertable anywhere in it. Postgres CPU on that route was 660%, 686% and 836%.
Our team has no explanation for that and did not manufacture one. The overhead does not bound the collapse either: 23% does not turn 25,426 requests a second into 63.3.
The benchmark's own defects
Two entries in the friction log would have printed a wrong number in this article.
Before each run the harness waits for the machine to go quiet. waitIdle() called otherCpu(0), with no application pid and no database name, so the exclusion its own comment promised never applied to Postgres, and the gate was catching our own backends and refusing to start. Caught live against a stalled run: at the same instant, otherCpu(0) returned 818% and otherCpu(app, 'bench_shop_t') returned 10%. On Linux ps reports %cpu as a process's whole-life average, so ten idle pool connections still read about 85% each. That is one bug. The second is why passing the arguments through would not have been enough on its own: the check recognised our database by name, and a process title does not always carry one. A client backend prints the name. The cluster's own auxiliary processes print none. TimescaleDB's scheduler workers print an OID instead, as in postgres: TimescaleDB Background Worker Scheduler for database 471720, so a name match does not see them either. Those workers were awake because create_order was inserting rows, which means the run was being charged for its own background cost.
T's block was restarted from scratch afterwards, into its own results file. So V1 and V2 were measured interleaved with each other, and T was not measured alongside them. The two T passes also disagree by more than the noise floor on the routes that did not collapse: search reads 178 in the superseded pass and 137 in the kept one, which is the one quoted here. Which pass a number came from is not an explanation for the 23%, and our team is not offering it as one. On the route that collapsed hardest the two agree to the digit, catalog at 0.6 requests a second in both.
The second entry is the aggregate refresh. TimescaleDB schedules every new policy to run immediately, so the columnstore and refresh policies ran during the load, and bun db/refresh.ts t then measured 0.7 s of six calls that each answered "already up to date". That would have gone into the report as T refreshing its aggregates 150 times faster than V2. Re-measured on an idle box, the nightly cost is V2 102.7 s and T 169.2 s.
Analytics splits two ways
table view
| query | window | design | rps | p50 | p99 |
|---|---|---|---|---|---|
| revenue | 7d | V1 | 243 | 41.45 ms | 45.24 ms |
| revenue | 7d | V2 | 6,712 | 1.45 ms | 2.23 ms |
| revenue | 7d | T | 6,673 | 1.46 ms | 2.24 ms |
| revenue | 3mo | V1 | 40.0 | 233.01 ms | 355.50 ms |
| revenue | 3mo | V2 | 11,084 | 0.88 ms | 1.49 ms |
| revenue | 3mo | T | 10,848 | 0.96 ms | 1.59 ms |
| revenue | 730d | V1 | 7.3 | 1.3 s | 1.9 s |
| revenue | 730d | V2 | 1,680 | 5.87 ms | 9.30 ms |
| revenue | 730d | T | 1,645 | 6.01 ms | 9.28 ms |
| top-products | 7d | V1 | 83.4 | 114.97 ms | 147.82 ms |
| top-products | 7d | V2 | 108 | 89.99 ms | 116.88 ms |
| top-products | 7d | T | 102 | 91.73 ms | 141.84 ms |
| top-products | 3mo | V1 | 9.2 | 1.0 s | 1.3 s |
| top-products | 3mo | V2 | 16.8 | 579.92 ms | 671.19 ms |
| top-products | 3mo | T | 19.6 | 481.35 ms | 673.12 ms |
| top-products | 730d | V1 | 1.6 | 5.1 s | 6.3 s |
| top-products | 730d | V2 | 2.7 | 3.5 s | 3.8 s |
| top-products | 730d | T | 5.0 | 1.8 s | 2.7 s |
| funnel | 7d | V1 | 5.2 | 1.7 s | 2.6 s |
| funnel | 7d | V2 | 45,433 | 0.22 ms | 0.51 ms |
| funnel | 7d | T | 37,379 | 0.25 ms | 0.78 ms |
| funnel | 3mo | V1 | 0.0 | 42.9 s | 43.6 s |
| funnel | 3mo | V2 | 43,493 | 0.22 ms | 0.65 ms |
| funnel | 3mo | T | 16,657 | 0.59 ms | 1.06 ms |
| funnel | 730d | V1 | invalid | 900.0 s | 900.0 s |
| funnel | 730d | V2 | 14,500 | 0.61 ms | 1.17 ms |
| funnel | 730d | T | 2,205 | 4.39 ms | 6.14 ms |
| cohorts | 7d | V1 | not run | — | — |
| cohorts | 7d | V2 | not run | — | — |
| cohorts | 7d | T | not run | — | — |
| cohorts | 3mo | V1 | 5.3 | 1.8 s | 2.3 s |
| cohorts | 3mo | V2 | 13.7 | 679.73 ms | 992.33 ms |
| cohorts | 3mo | T | 2.4 | 3.6 s | 5.8 s |
| cohorts | 730d | V1 | invalid | 900.0 s | 900.0 s |
| cohorts | 730d | V2 | 2.6 | 3.3 s | 4.9 s |
| cohorts | 730d | T | 0.3 | 17.6 s | 22.3 s |
| category-trend | 7d | V1 | not run | — | — |
| category-trend | 7d | V2 | not run | — | — |
| category-trend | 7d | T | not run | — | — |
| category-trend | 3mo | V1 | 8.8 | 1.1 s | 1.5 s |
| category-trend | 3mo | V2 | 676 | 14.07 ms | 22.35 ms |
| category-trend | 3mo | T | 850 | 11.35 ms | 18.75 ms |
| category-trend | 730d | V1 | 1.9 | 4.7 s | 7.1 s |
| category-trend | 730d | V2 | 87.1 | 112.67 ms | 156.86 ms |
| category-trend | 730d | T | 120 | 80.62 ms | 127.96 ms |
The analytics routes ran at concurrency 10 with Redis bypassed, on a cold cache, and the result splits by query shape rather than by product.
T wins where the answer needs a compressed scan over a lot of rows. top-products over 730 days runs at 5.0 requests a second against V2's 2.7 and V1's 1.6, with p99 falling from 3,770.21 ms to 2,674.36 ms. category-trend over the same window reads 120 against V2's 87.1.
T loses where a materialized view has already reduced the answer to a handful of rows. funnel over 730 days reads 2,205 against V2's 14,500, and cohorts over the same window 0.3 against V2's 2.6, with p99 going from 4,910.25 ms to 22,269.56 ms. On revenue the two are level at every window.
V1 could not complete funnel or cohorts at 730 days at all: 100% non-2xx with p99 at 900 s, a withheld cell and never a throughput. The funnel metric, separately, counts event totals and session-days rather than distinct sessions, because a pre-aggregated design cannot recover a distinct count from daily rows, so all three report the same countable thing.
Where the extension pays
One aggregate came out larger compressed than it was as rows. Compression is a property of the data in a chunk, not a setting that always pays.
table view
| design | database size | relations | largest relations |
|---|---|---|---|
| V1 | 20.57 GB | 6 | events 17.62 GB, order_items 2.16 GB, orders 744.5 MB, customers 51.0 MB |
| V2 | 17.34 GB | 93 | events_202609 1.11 GB, mv_product_daily 756.2 MB, events_202607 710.7 MB, events_202511 694.1 MB |
| T | 4.42 GB | 6 | customers 51.0 MB, products 10.5 MB, categories 80.0 kB, order_items 24.0 kB |
pg_total_relation_size over every relation in each database, and the ratios from hypertable_columnstore_stats. A ratio covers only the chunks that are actually compressed, so a hypertable whose newest chunk is still in the rowstore saves less overall than its ratio suggests. The same rows were loaded byte for byte into all three databases.V1 occupies 20.57 GB across 6 relations, 17.62 GB of it the events table, 48.6% of which is index. V2's partitioning brings the total to 17.34 GB. T holds the same rows in 4.42 GB, and its largest single relation is customers at 51.0 MB. Against the tuned build that is 3.9×, and it is the one place where the extension needs no argument.
One compression ratio in that table goes the wrong way. cagg_customer_monthly compresses to 0.6×, which is to say it grew: 330.8 MB before, 556.7 MB after. Compressing a continuous aggregate whose rows are already few and wide can cost more than it saves, and the columnstore does it anyway if you tell it to. The uncompressed chunk in each hypertable is the newest one, inside the 7-day window, left in the rowstore.
Write-ahead log volume runs the same direction. T writes the least WAL per event at every batch size tested: at one event per request, 191.0 bytes against V1's 346.9 and V2's 226.2, and the ordering holds at 50 and 500. Ingest throughput does not follow: at batch size 50, T accepts 60,553 events a second against V1's 217,270 and V2's 220,109, and by batch 500 the gap closes again.
The bill arrives at build time. From empty schema to serving traffic, V1 takes 213.8 s, V2 414.1 s and T 1,141.3 s, of which the events COPY alone is 522.3 s into 730 daily chunks, a six-fold backfill penalty for unsorted historical data, paid again on every restore.
The storefront while the dashboard runs
table view
| design | rps alone | rps under load | Δ rps | p99 alone | p99 under load | Δ p99 | Postgres CPU |
|---|---|---|---|---|---|---|---|
| V1 | 103 | 88.3 | −14.6% | 501.04 ms | 3.3 s | +563.6% | 938% |
| V2 | 91.4 | 76.0 | −16.8% | 558.75 ms | 4.4 s | +689.1% | 908% |
| T | 0.6 | 0.6 | −5.9% | 79.5 s | 90.6 s | +14.0% | 871% |
GET /products?category=7 measured on its own, then measured again while cohorts and rfm over the 730-day window, pumped continuously against the same database. Noise floor 0.9%. The Postgres CPU column is the sum over every backend during the second measurement; 100% is one core, and this machine has 20.The catalog route was measured twice: alone, and again while cohorts and rfm over a 730-day window were pumped continuously at the same database, which is the case a hypertable is meant for.
T's throughput drop under load is the smallest of the three, at 5.9%, and its p99 rises 14.0% where V1's rises 563.6% and V2's 689.1%. None of that is resilience. T was serving 0.6 requests a second before the dashboard load arrived and 0.6 after it, at a p99 that starts at 79.5 seconds. Postgres CPU under load read 938%, 908% and 871%: the same box working about as hard for very different amounts of traffic.
The write route that looks like a win
POST /orders is the only route where T posts a valid number and the other two are withheld: 56.0 requests a second at concurrency 50, p99 1,069.19 ms, against 90.00% non-2xx on V1 and 77.59% on V2. It is not a TimescaleDB result. The cause sits in the application layer that all three share:
SELECT coalesce(max(id), 0) + 1 FROM orders;
The id is read, then inserted, so concurrent requests reuse the same one. The naive build keys orders on id alone, which makes that a duplicate key, and all but one request loses: 90.00% of them did. The tuned build keys on (id, created_at), where a collision also needs the same timestamp, and 77.59% still failed. The harness recorded the status of those requests and not the error text, so the second figure is consistent with the same race rather than proof of it. T survives it because it is slow enough that requests barely overlap. The bug was left in place deliberately, since fixing it mid-comparison would have changed the application the three variants share. The one write route T appears to win measures an id-allocation race.
How this was measured
A 12th Gen Intel Core i7-12700, 20 cores, 31 GB of RAM, Ubuntu 26.04.1 LTS on kernel 7.0.0-30-generic. PostgreSQL 18.6, TimescaleDB 2.29.2, Bun 1.4.1, drizzle-orm 0.45.2, Redis 8.0.5. shared_buffers 7536648kB, work_mem 20480kB, effective_cache_size 22282248kB, max_parallel_workers_per_gather 8 and random_page_cost 1.1, identical across all three databases. The load generator ran on the same host as the application and the database. Every figure is the median of three 30-second bombardier runs after a 5-second warm-up, OLTP routes at concurrency 50 and 200, analytics at 10, in the order V1, V2, T.
The noise floor was measured. Five back-to-back 30-second runs on V1 at concurrency 100, nothing else changing, gave health at 217,665, 218,510, 216,992, 217,964 and 217,302 requests a second, a spread of 0.7%, and catalog at 105, 105, 105, 104 and 105, a spread of 0.9%. So the floor is 0.9%, and anything under it is the machine.
Any combination with more than 1% non-2xx responses is withheld and never quoted as a throughput, because that number counts refused connections. Six are withheld on that rule: V1's create_order at concurrency 50 and 200 (90.00% non-2xx), V2's at both (77.59% and 77.41%), and V1's funnel and cohorts at 730 days (100% non-2xx, p99 900 s). cohorts and rfm have no 7-day row, because both compare whole months and a 7-day window does not align to month boundaries. The run also carried a memory upper bound summing RSS across every backend, which counts shared_buffers once per backend; it is not quoted here, because it cannot be read as a memory figure.
This is one machine, one dataset shape and one afternoon. It measures these thirteen routes on this data; it is not a benchmark of TimescaleDB.
What that leaves
TimescaleDB was built for queries that name a time range, and on those it does what the documentation says: 4.42 GB where the hand-tuned build needs 17.34 and the naive one 20.57, 191.0 bytes of WAL per event against 226.2 and 346.9, and a compressed scan over two years of order items that beats a hand-built materialized view.
The queries a storefront actually serves mostly do not name a time range. On the plan that mattered here, bloom pruned 99.0% of batches across 208 compressed chunk scans, and the planner excluded no chunks at all, zero at startup and zero at runtime.